
What Are Energy Efficiency Solutions for Global Buyers?
Global buyers are rethinking energy costs as supply risks, climate pressures, and stricter efficiency requirements reshape procurement. Energy efficiency solutions now include high-efficiency motors, smart controls, heat pumps, insulation, efficient lighting, and on-site monitoring. The right choice depends on a facility’s climate, operating schedule, energy tariffs, and maintenance capacity.
Amory Lovins, cofounder of the Rocky Mountain Institute and a respected energy-efficiency expert, has said, “The cheapest energy is the energy you don’t use.” That principle remains practical in warehouses, factories, offices, and retail sites. A buyer can see its value in simple details: a variable-speed drive reducing motor load, sensors dimming lights in empty aisles, or improved insulation keeping a cold room stable.
Small changes matter.
Yet global purchasing decisions require more than attractive savings estimates. Buyers should examine total ownership costs, verified performance data, product durability, warranty terms, installer qualifications, and compatibility with local electrical standards. Independent measurement can confirm whether projected savings become real savings. Without it, a polished proposal may hide weak assumptions.
Not every solution performs equally well everywhere. A system designed for a humid coastal facility may underperform in a dry inland warehouse. Payback periods can also disappoint when energy prices, production levels, or maintenance practices change. This is where careful expertise matters. Reliable energy efficiency solutions should reduce consumption while supporting operational resilience, worker comfort, and long-term financial value. The following guide explores how international buyers can compare technologies, suppliers, risks, and measurable results with greater confidence.
What Energy Efficiency Solutions Mean for Global Buyers
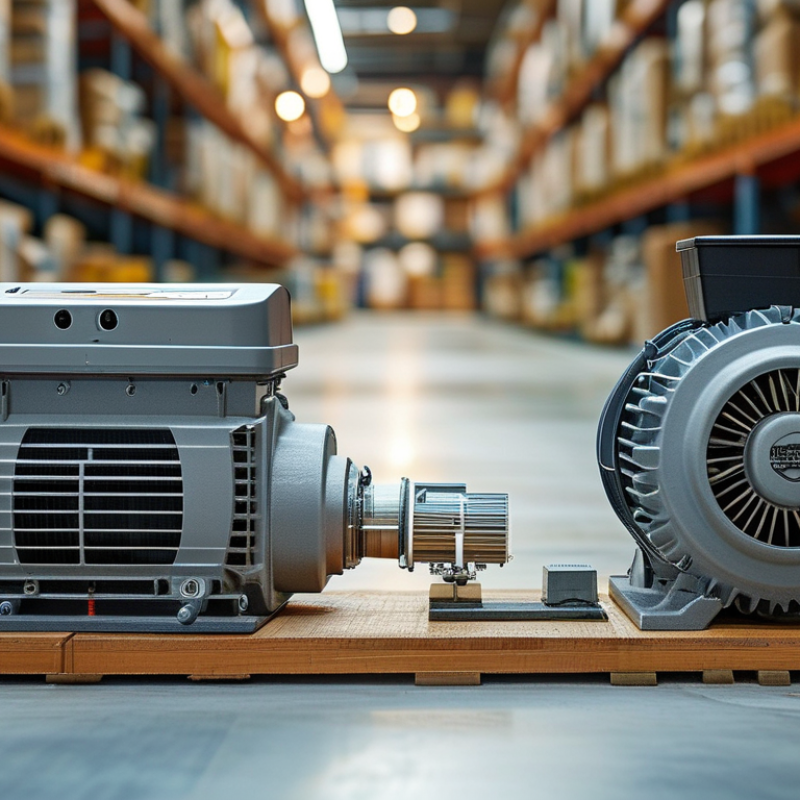
Energy efficiency solutions mean practical ways for global buyers to reduce energy use without weakening daily operations. They may include high-efficiency motors, smart lighting, insulation, heat recovery, and automated controls. The right choice depends on climate, building age, operating hours, and local energy prices. A cold warehouse needs different measures than a sunny office. Reliable buyers should request tested performance data, installation requirements, maintenance details, and expected service life. Energy savings should be measured, not simply promised.
Tips: Compare total lifecycle cost, not only the purchase price. Ask for independent test reports and realistic payback estimates. Check whether local technicians can install and maintain the equipment. Begin with an energy audit, then monitor consumption through sub-meters. Small leaks, poor scheduling, and outdated controls often waste more energy than expected.
Global purchasing also requires careful risk management. Standards, voltage conditions, climate exposure, and documentation can vary across markets. A solution that performs well in one country may need adjustment elsewhere. We have seen efficiency plans fail when staff receive little training or sensors are poorly positioned. That weakness deserves attention. Buyers should set measurable targets, such as reducing monthly electricity use by 15 percent, and review results after installation. Transparent records, clear warranties, and responsive technical support make energy decisions more dependable. Perfect forecasting is impossible, but disciplined measurement improves each next decision.
| Solution Category | Typical Application | Primary Energy-Saving Mechanism | Indicative Energy Reduction | Typical Payback Period | Key Buyer Benefits | Important Evaluation Metrics |
|---|---|---|---|---|---|---|
| LED Lighting and Smart Controls | Warehouses, offices, retail facilities, factories, and outdoor areas | More efficient light sources combined with occupancy, daylight, and scheduling controls | 30%–70% of lighting electricity use | 1–4 years | Lower electricity consumption, reduced maintenance, longer equipment life, and improved lighting quality | Lighting power density, operating hours, illuminance level, control coverage, and maintenance cost |
| High-Efficiency Motors and Variable-Speed Drives | Pumps, fans, compressors, conveyors, and industrial production equipment | Higher motor efficiency and speed control that matches output to actual demand | 10%–40% for suitable variable-load systems | 1–5 years | Reduced motor losses, smoother operation, lower peak demand, and better process control | Motor efficiency class, load profile, annual running hours, speed range, and power factor |
| HVAC Optimization and Building Automation | Commercial buildings, hotels, hospitals, data facilities, and industrial sites | Automated temperature control, scheduling, zoning, ventilation management, and fault detection | 10%–30% of HVAC energy use | 2–6 years | Lower heating and cooling costs, improved occupant comfort, and better operational visibility | Seasonal efficiency, set points, indoor-air quality, runtime, outside-air rate, and control accuracy |
| Heat Pumps and Heat Recovery | Space heating, water heating, drying, refrigeration, and industrial low-temperature processes | Transfers or recovers heat instead of generating all heat directly from fuel or resistance electricity | 20%–50% reduction in heating energy in suitable applications | 3–8 years | Lower fuel use, reduced onsite emissions, and improved heating-system flexibility | Seasonal coefficient of performance, source temperature, supply temperature, refrigerant, and backup-heating requirement |
| Industrial Waste-Heat Recovery | Furnaces, kilns, boilers, compressors, exhaust systems, and process heating lines | Captures usable heat from exhaust gases, hot liquids, or process equipment for reuse | 5%–20% of total site energy use | 2–6 years | Lower fuel consumption, reduced cooling demand, and improved overall process efficiency | Waste-heat temperature, flow rate, operating hours, heat-exchanger effectiveness, and fouling risk |
| Compressed-Air System Optimization | Manufacturing plants using pneumatic tools, controls, or production equipment | Leak repair, pressure reduction, efficient sequencing, storage optimization, and heat recovery | 10%–30% of compressed-air energy use | Less than 1–3 years | Lower electricity consumption, more stable pressure, reduced compressor wear, and fewer production losses | Leakage rate, system pressure, specific power, compressor part-load performance, and pressure drop |
| Energy Monitoring and Submetering | Multi-site portfolios, factories, commercial buildings, and energy-intensive operations | Measures energy by process, area, or asset so that abnormal consumption and efficiency opportunities can be identified | 5%–15% through monitoring-led operational improvements | 1–3 years | Transparent cost allocation, faster fault detection, verified savings, and improved reporting | Measurement accuracy, data interval, baseline quality, coverage, alarms, and energy-use intensity |
| Building Envelope Improvements | Existing offices, warehouses, residential buildings, schools, and public facilities | Improves insulation, air tightness, glazing performance, shading, and solar heat control | 10%–30% of heating and cooling energy | 5–15 years | Lower thermal losses, improved comfort, reduced HVAC sizing, and better resilience to weather conditions | U-value, air-leakage rate, solar heat-gain coefficient, window orientation, and local climate |
| High-Efficiency Refrigeration | Cold storage, food distribution, supermarkets, laboratories, and process cooling | Efficient compressors, electronically commutated fans, floating head pressure, and optimized defrost cycles | 10%–30% of refrigeration energy use | 2–6 years | Lower operating costs, improved temperature stability, reduced product risk, and lower maintenance demand | Coefficient of performance, suction pressure, condensing temperature, defrost energy, and refrigerant impact |
| On-Site Renewable Energy with Load Management | Facilities with suitable roofs, land, or consistent daytime electricity demand | Offsets grid electricity use and aligns generation with controllable loads or storage | Site-specific; commonly 10%–40% of annual electricity demand | 5–12 years | Reduced grid purchases, improved price predictability, and progress toward emissions targets | Solar resource, system yield, self-consumption rate, export rules, degradation, and available roof area |
| Indicative ranges are general planning benchmarks, not guaranteed results. Actual savings and payback depend on climate, operating hours, energy prices, equipment condition, load profile, installation quality, financing, and local regulations. Buyers should require a site-specific baseline, measurement and verification plan, lifecycle-cost analysis, and applicable safety and efficiency certifications before procurement. | ||||||
Related Posts
-

Top Renewable Energy Solutions for 2026 to Watch Out For?
-
What Are the Benefits of Modern Electrical Systems for Businesses?
-

Top 10 Smart Energy Solutions for Global Buyers?
-
What Are the Top Electrical Design Concepts for 2026?
-
How to Ensure Safe Power Distribution in Global Sourcing?
-

Best Electrical Installation Ideas for Home and Office?